How To: Access Analytics & Logs
If your website is down, or not functioning as it should, taking a look through the site logs could help you identify what the issue is.
Our platform keeps both access and error logs for each site.
These are stored by the webserver that has served the request, either Apache or NGINX. Each log file is prefixed with the name of the web server and whether it is an access or error log.
These logs are refreshed each day and kept for 14 days. Any log files beyond this are deleted to save disk space.
The logs are kept in:
/home/storm/logs/WEBSITENAME/
Each website has its own directory.
You can also access the current live logs through our platform.
Please note: you will need to allow your IP to access logs.
1. To start your Log analysing journey, Log in on the platform.
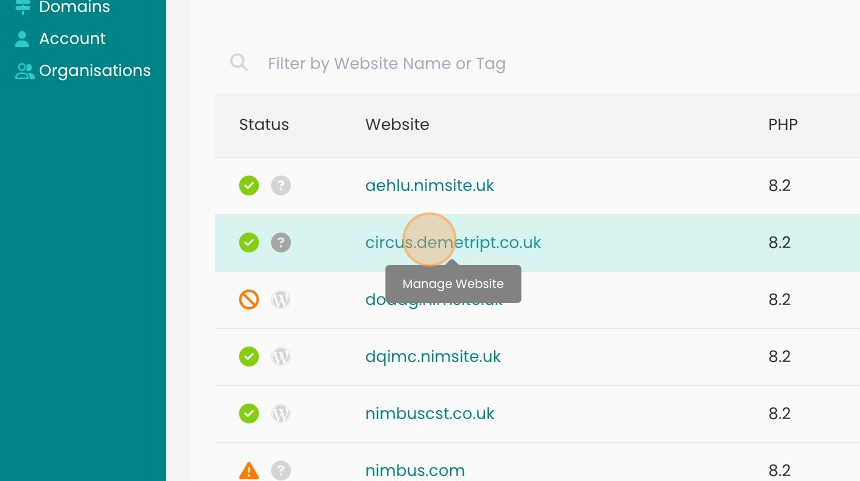
2. Click on the website for which you wish to see the logs.
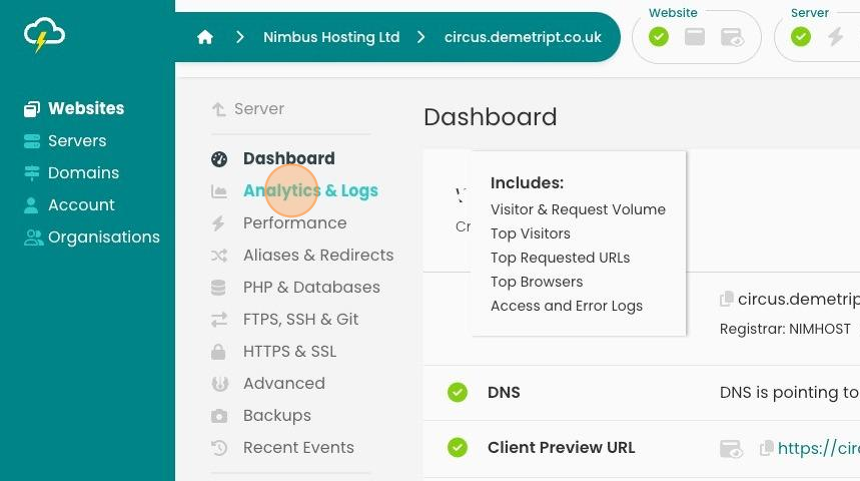
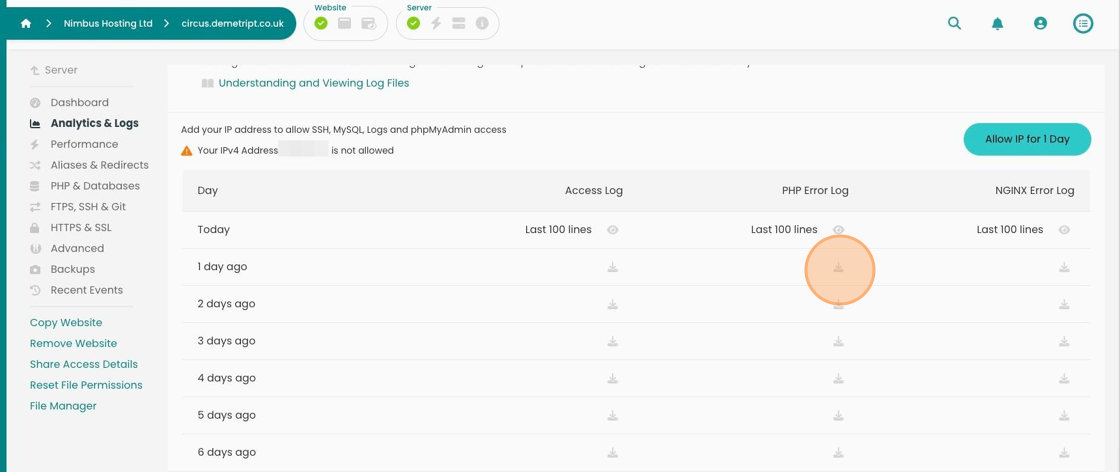
3. On the dashboard click "Analytics & Logs".
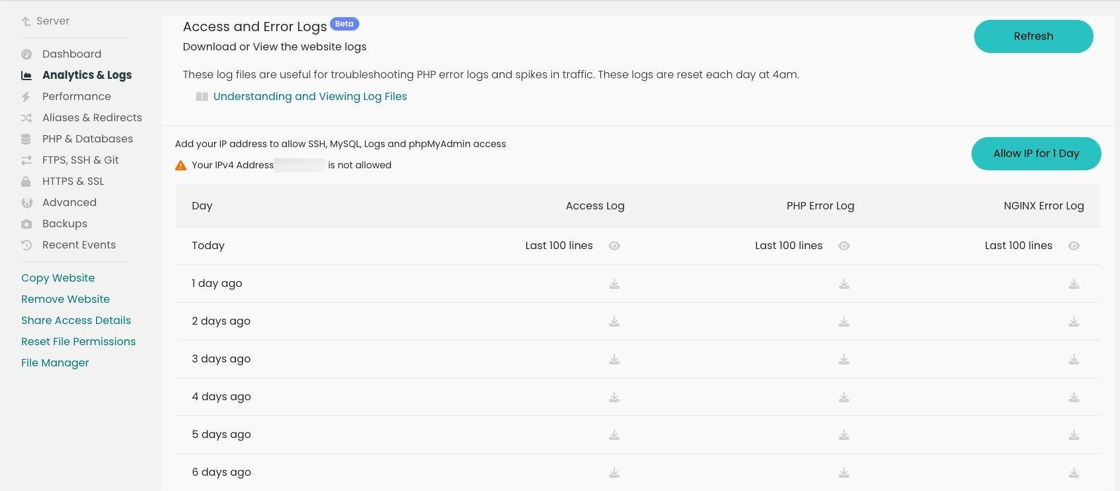
4. You are now able to see three different types:
Access, PHP Errors and NGINIX Error logs.
You can easily access up to 7 days of logs on the platform.
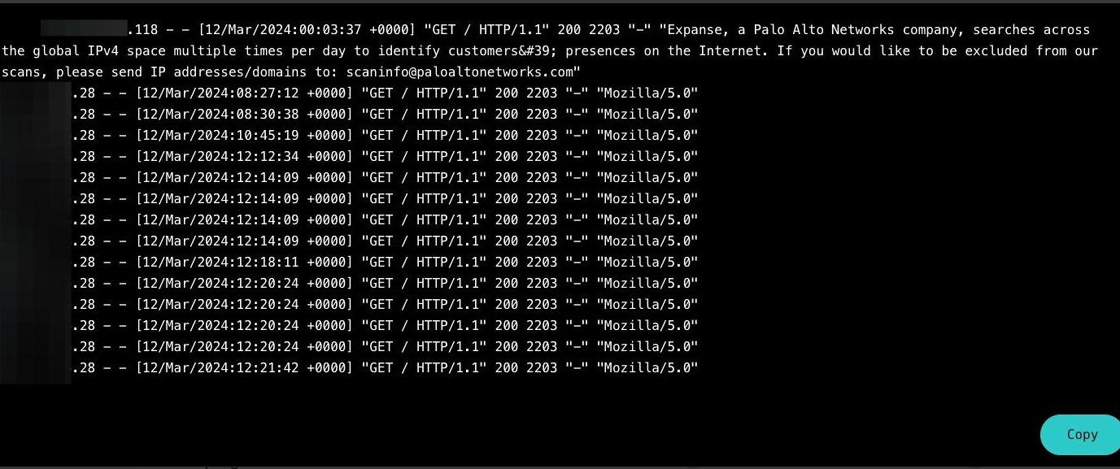
5. Say if you want to see an Access Log from the same day.
Click on the eye there and a window will pop up which displays the last 100 lines.
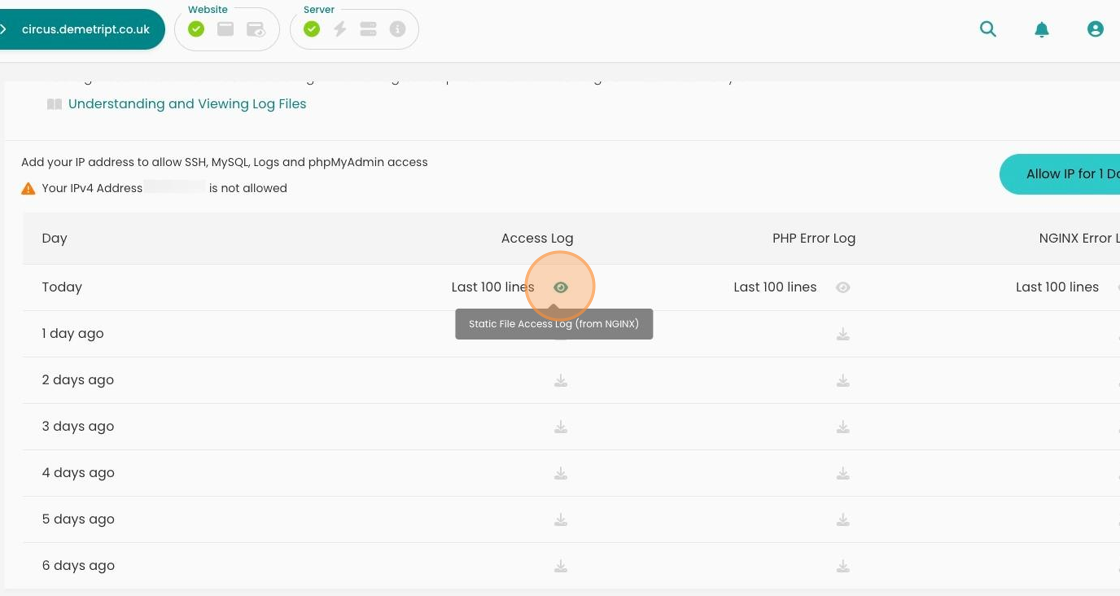
6. Here's an example.
7. You are given the option of downloading any of these logs up to 6 days ago by clicking the download icon.
Tip: You can open the resulting file in Notepad but we would recommend Notepad++ (https://notepad-plus-plus.org) for readability.
Looking for something else?
Check out these useful links to our website and other carefully curated resources:
Industry-leading insight reports